Supported Vehicles

Built for Your Platform

Spoolin has deep knowledge of each engine's tuning characteristics, expected parameters, and common failure modes, eliminating generic pattern matching.

BMW / Toyota
S63 N63 S58 S55 B58 B48 B46 B38 N55 N54 N20 N13
Nissan / Infiniti
VR38DETT VR30DDTT
Honda / Acura
L15Turbo K20C1 K20C4 / K20C2
See It In Action

Real Logs. Real Insights.

Each tab shows real screenshots taken from different user sessions within SpoolinOps.

spoolinops.com/chat
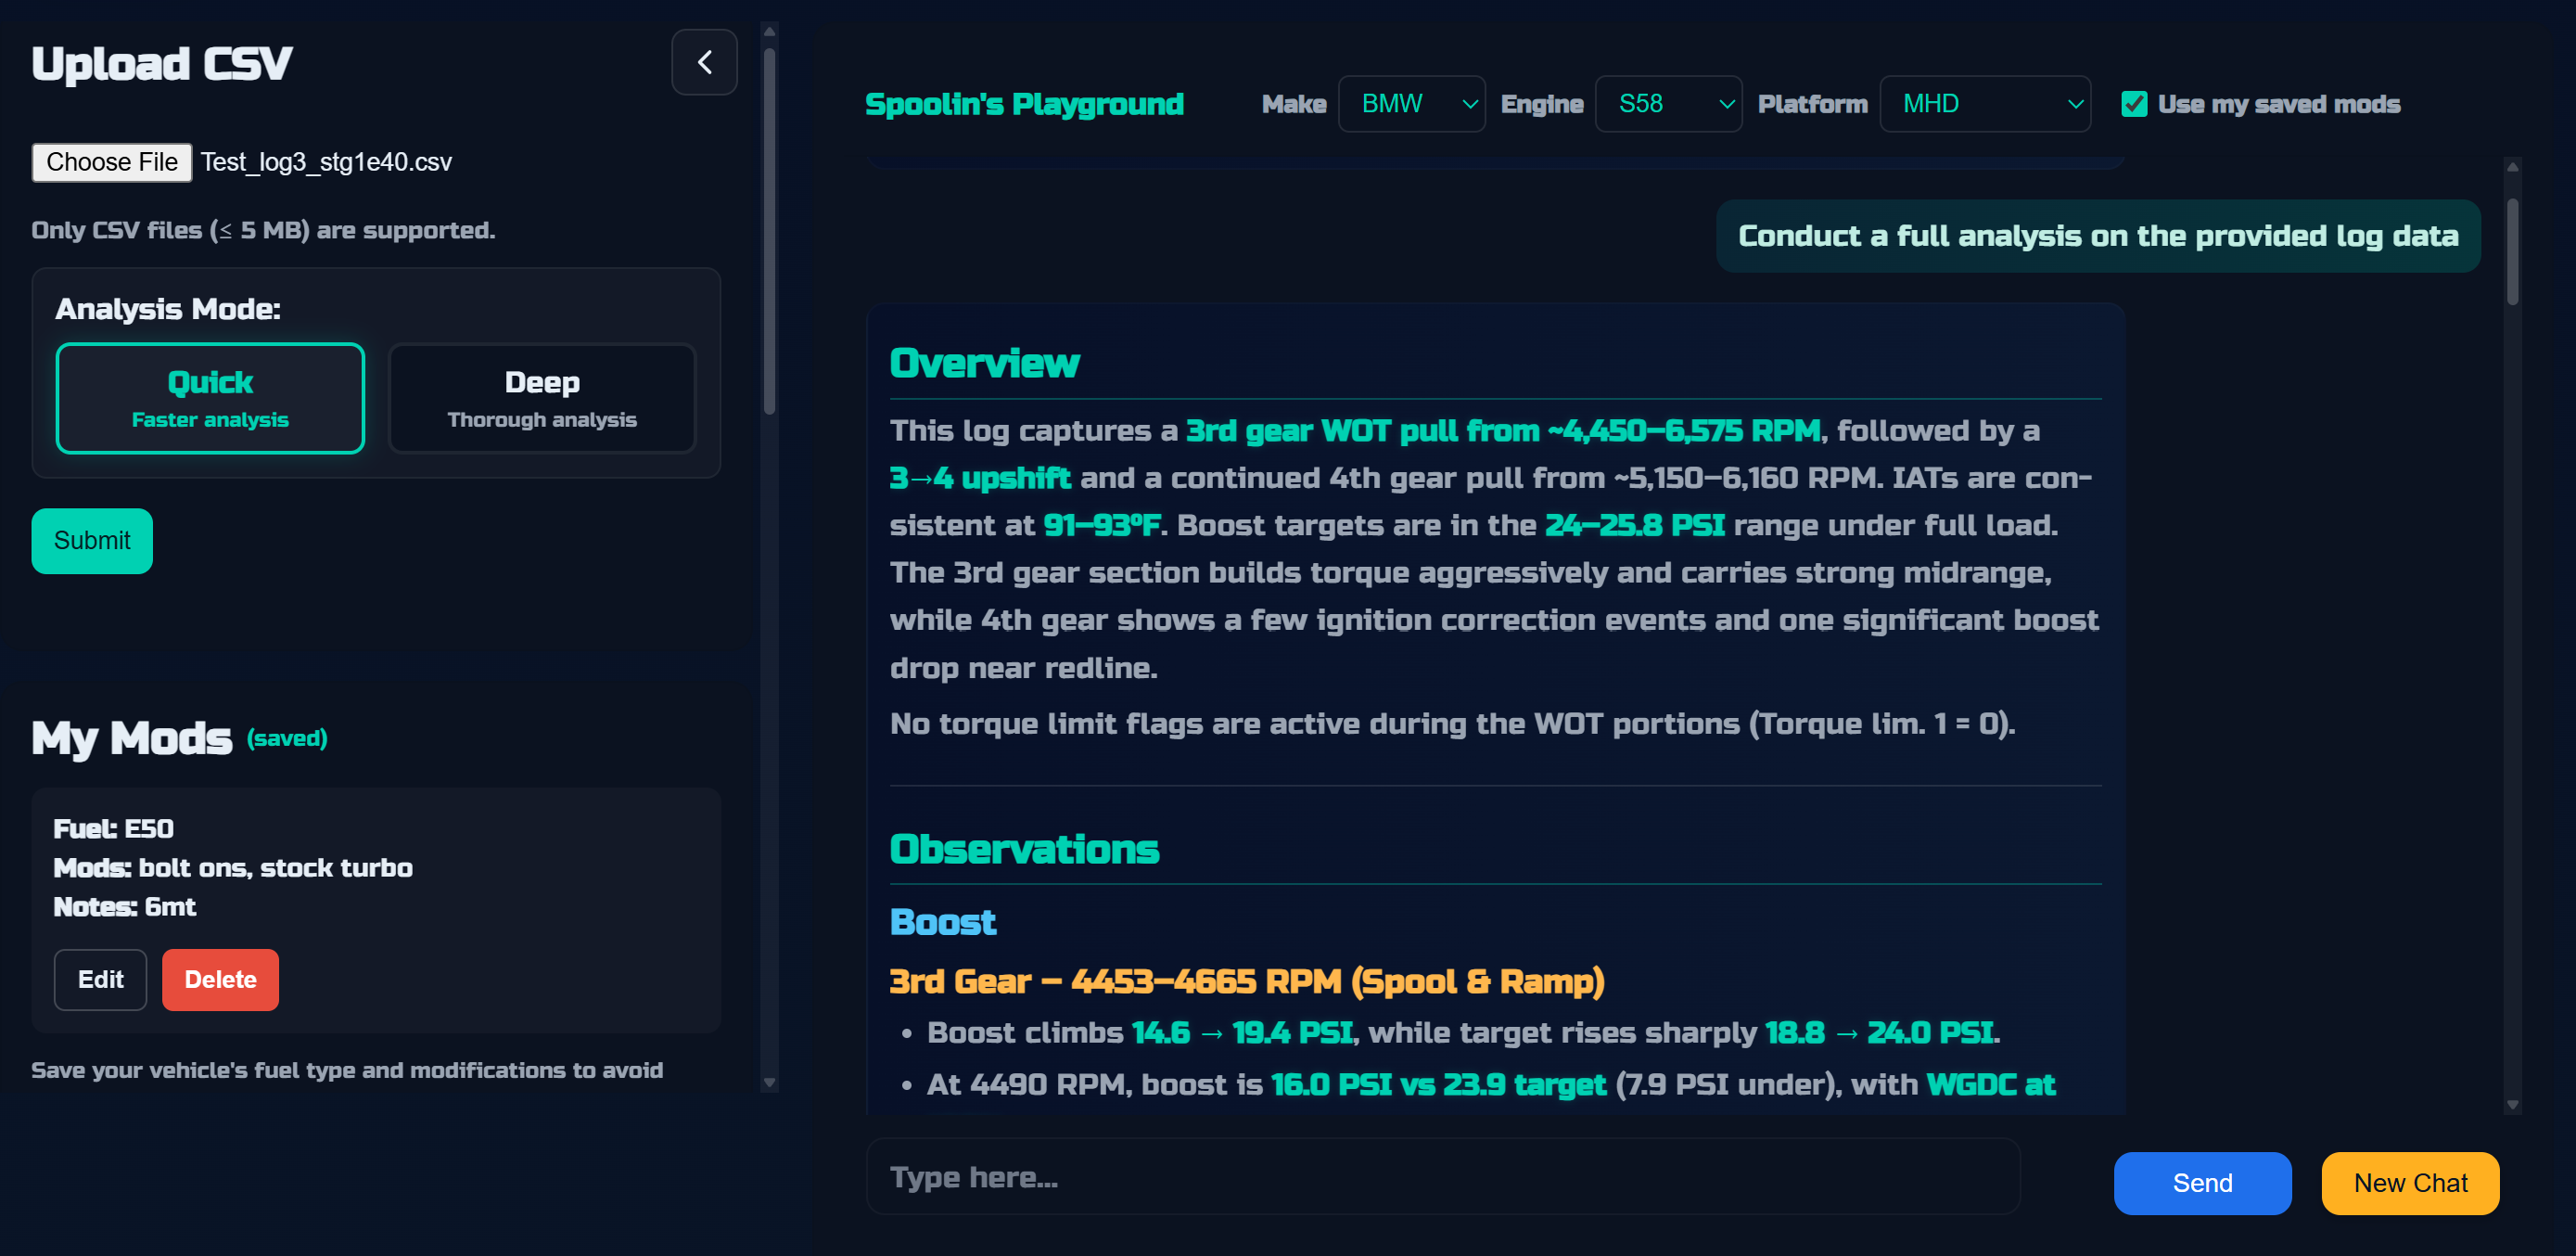
Spoolin AI log analysis interface showing vehicle setup panel, uploaded log, and AI-generated analysis with color-coded findings
Upload your datalog, select your vehicle and tuning platform, and Spoolin analyzes your pull in seconds, highlighting what's working, what needs attention, and why.
spoolinops.com/chat
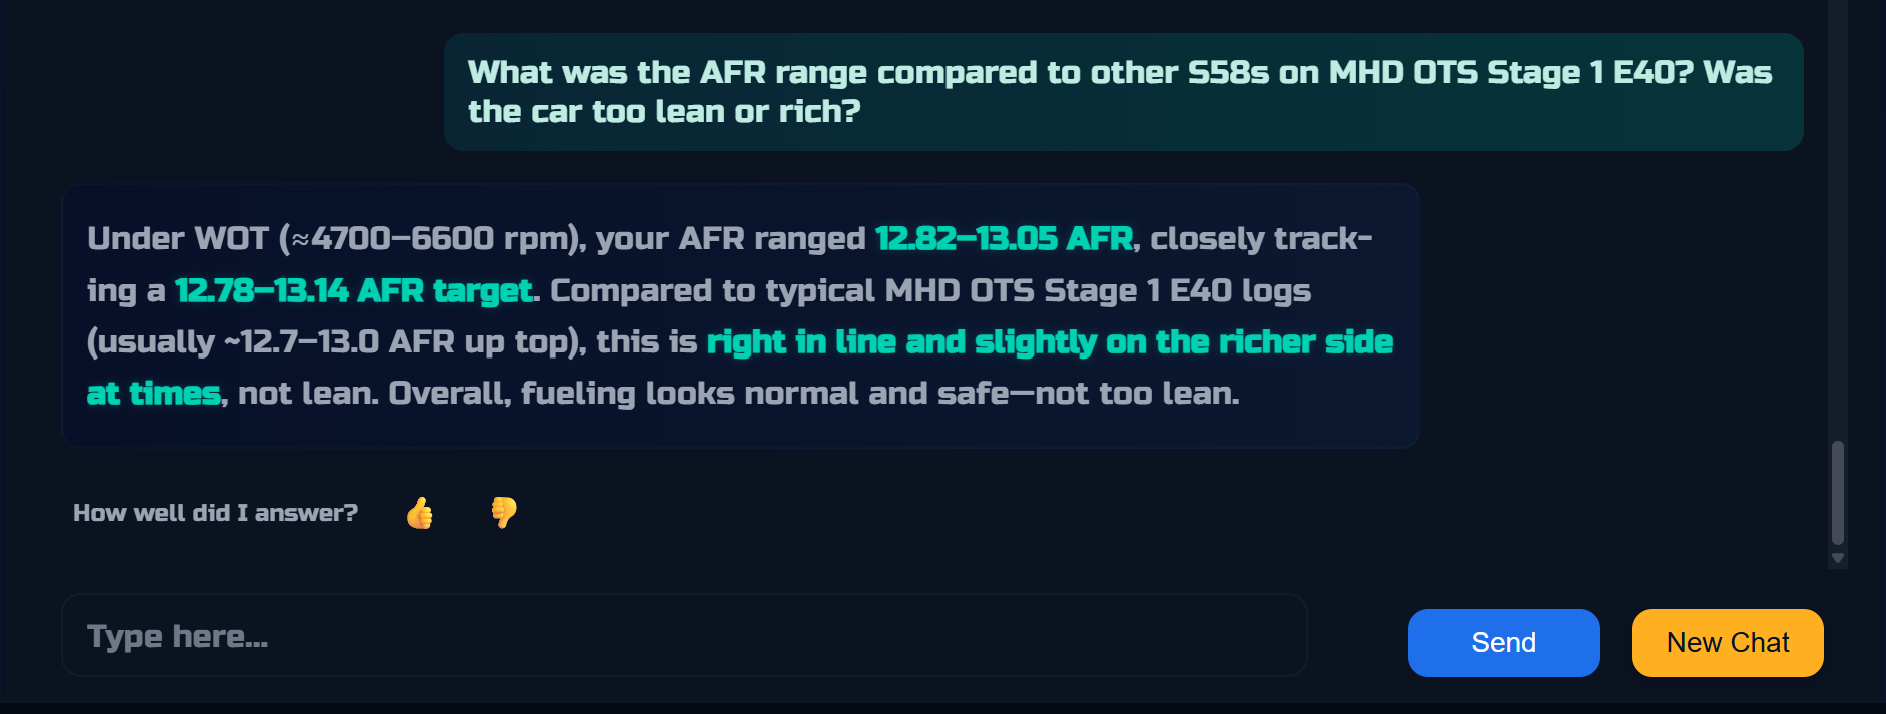
Spoolin AI responding to a follow-up question about AFR range on an S58 MHD Stage 1 E40 tune
Ask follow-up questions, dive deeper into your log, and get answers with your datalog kept in context throughout the conversation.
spoolinops.com/chat
SpoolinOps calculating a 60 to 130 mph acceleration time directly from an uploaded MHD datalog
Calculate acceleration intervals such as 60-130 mph or 100-200 km/h directly from your datalog, with dynamic range suggestions and automatic unit conversion.
spoolinops.com/chat
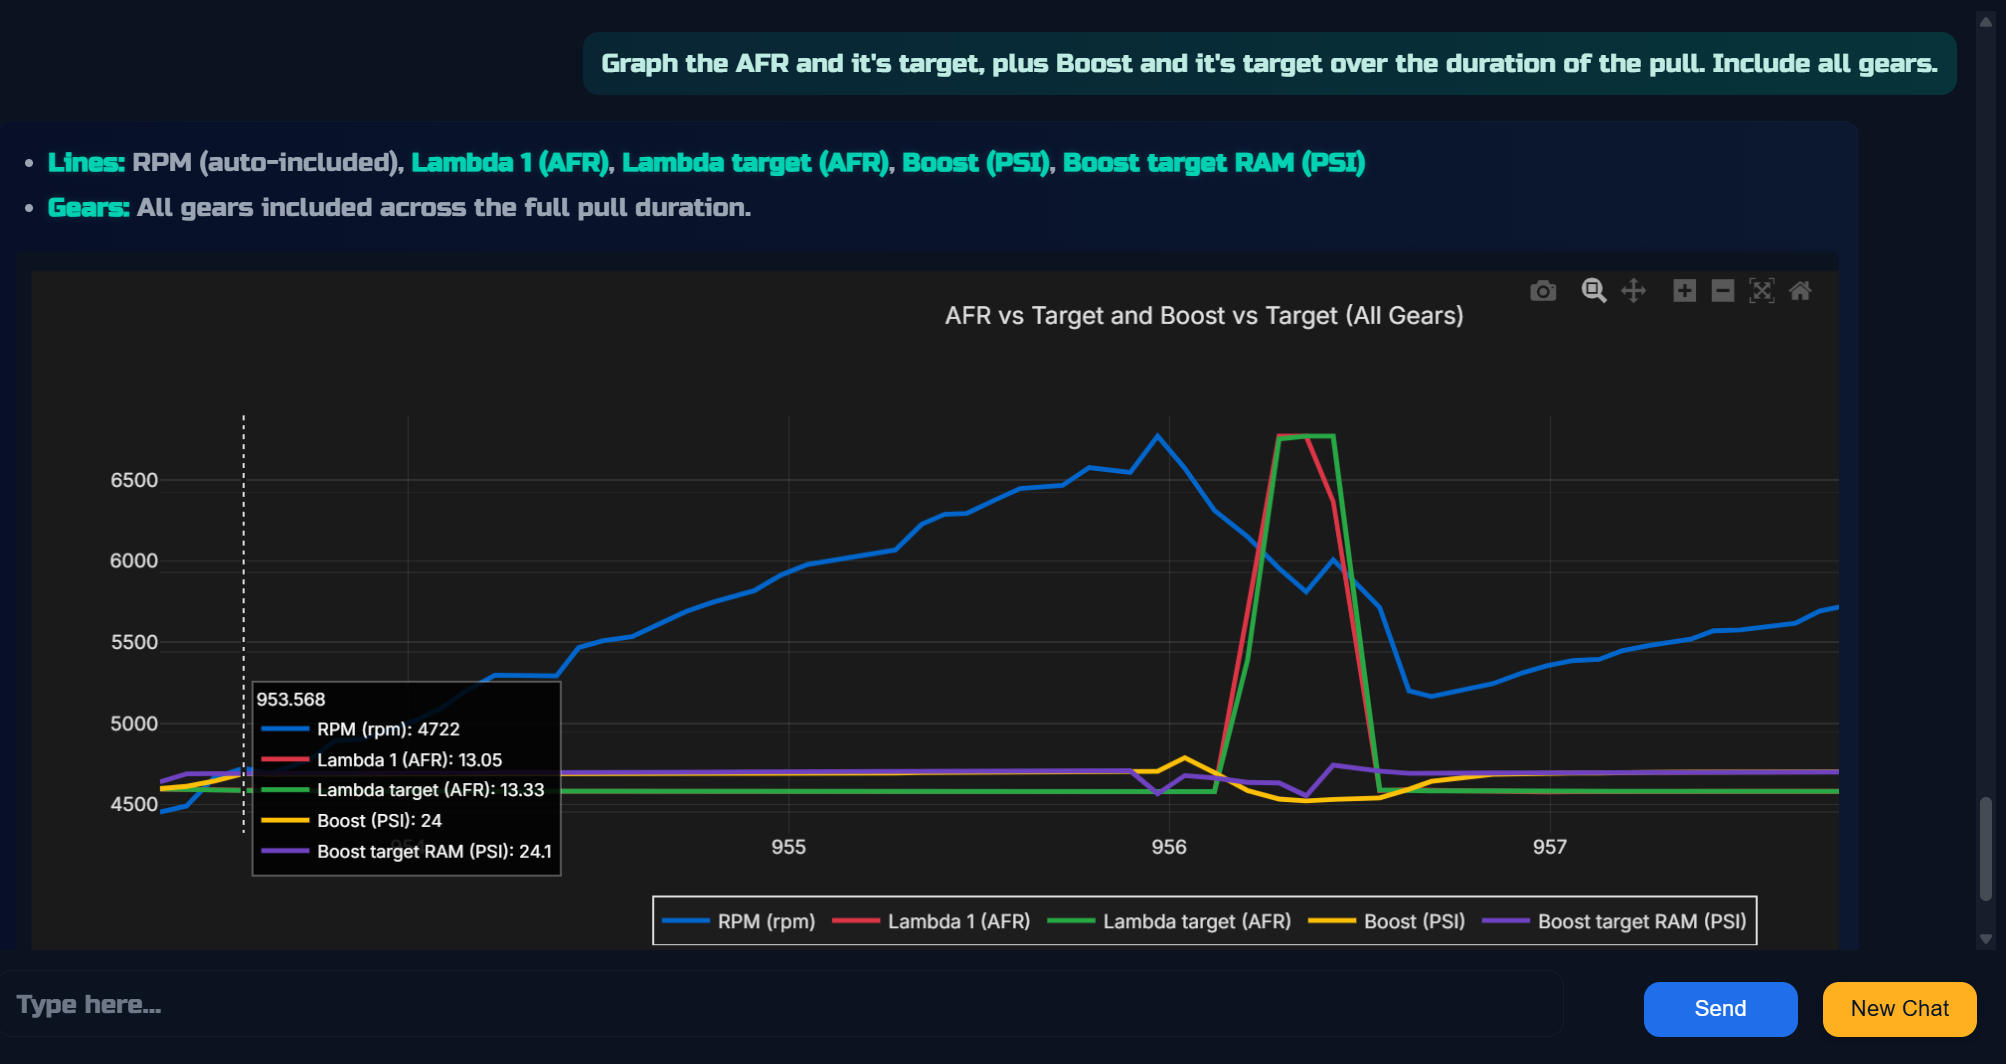
Interactive graph showing AFR vs Target and Boost vs Target across all gears, with hover tooltip
Need a graph? Just ask. Spoolin builds it directly from your datalog with interactive hover details. No external tools required.
spoolinops.com/visualization
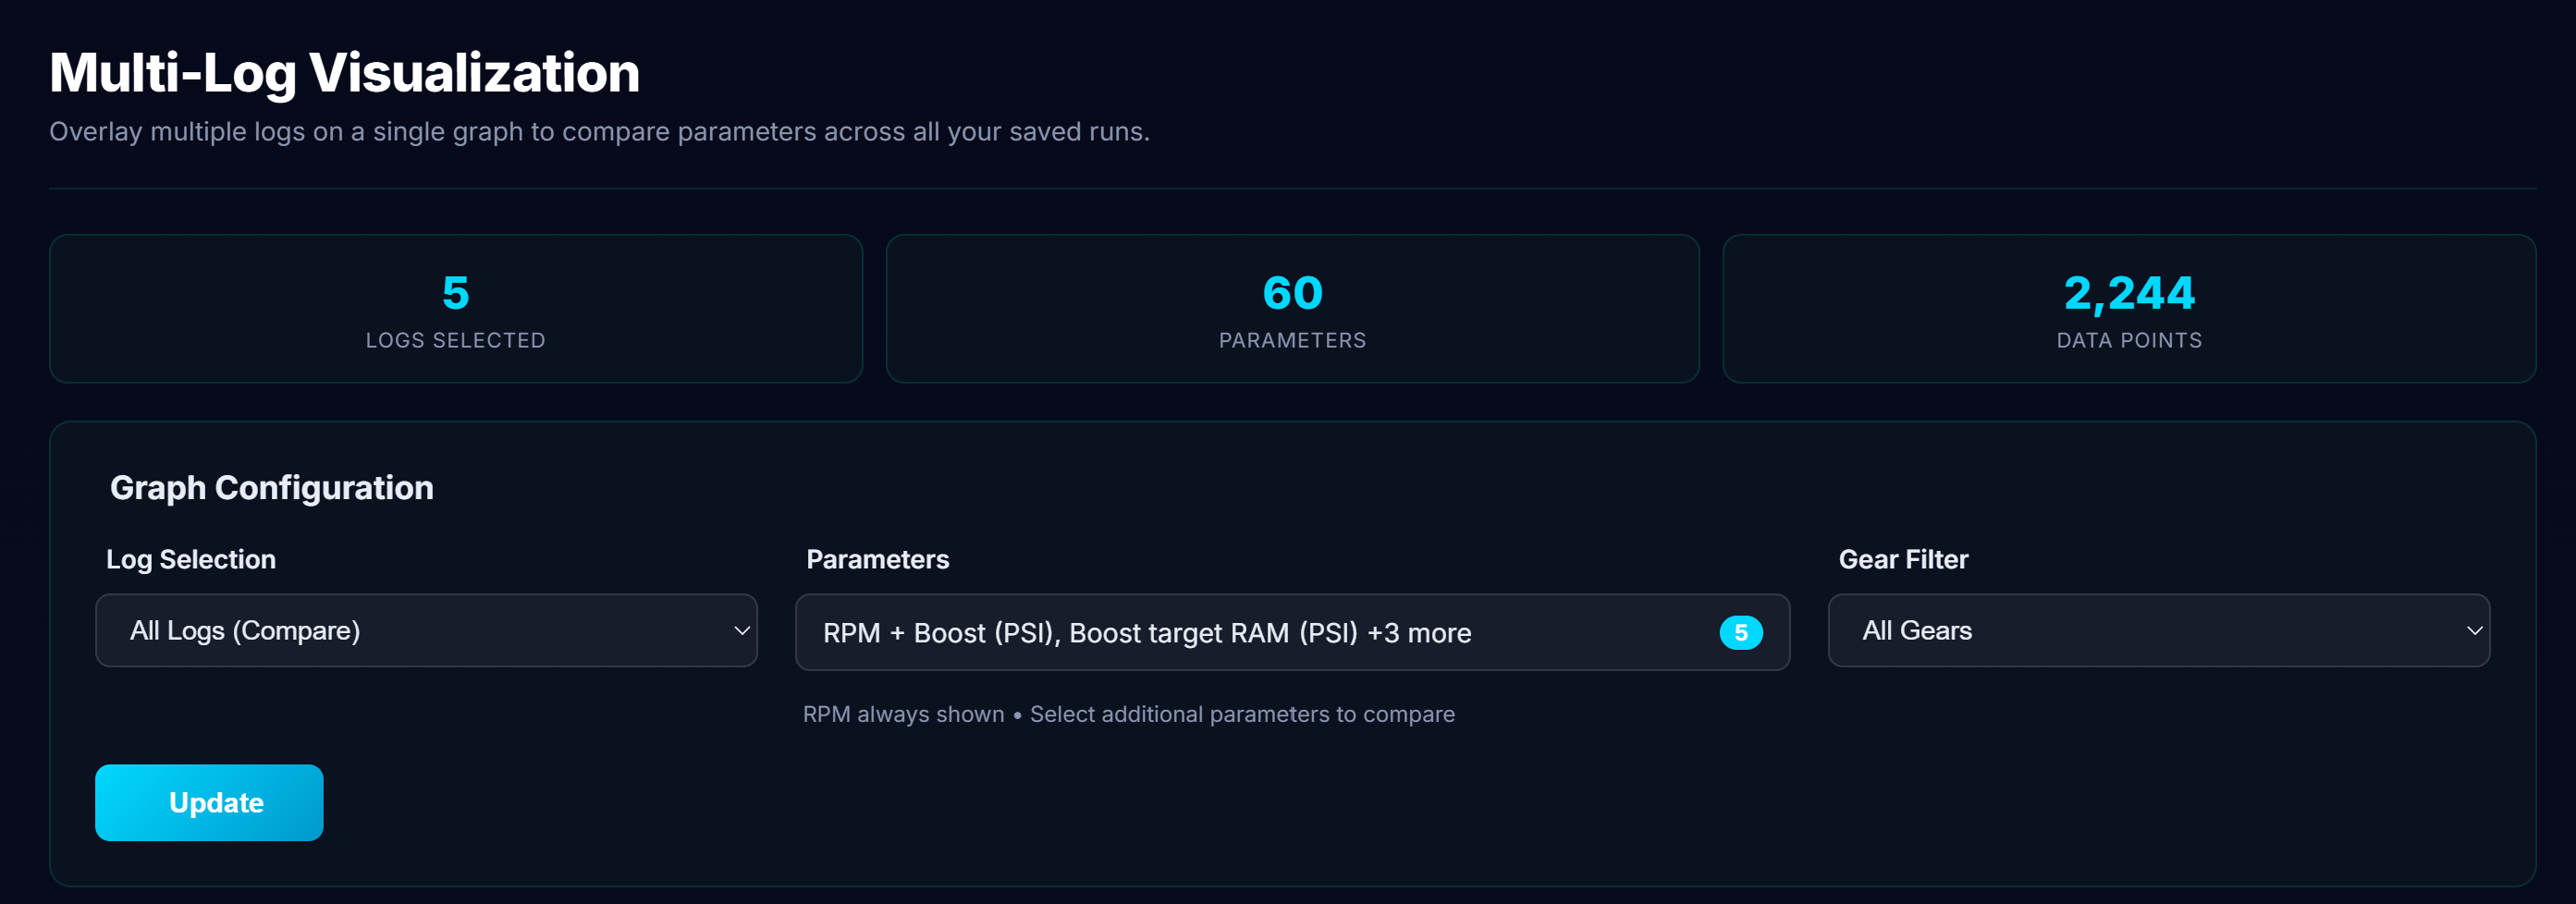
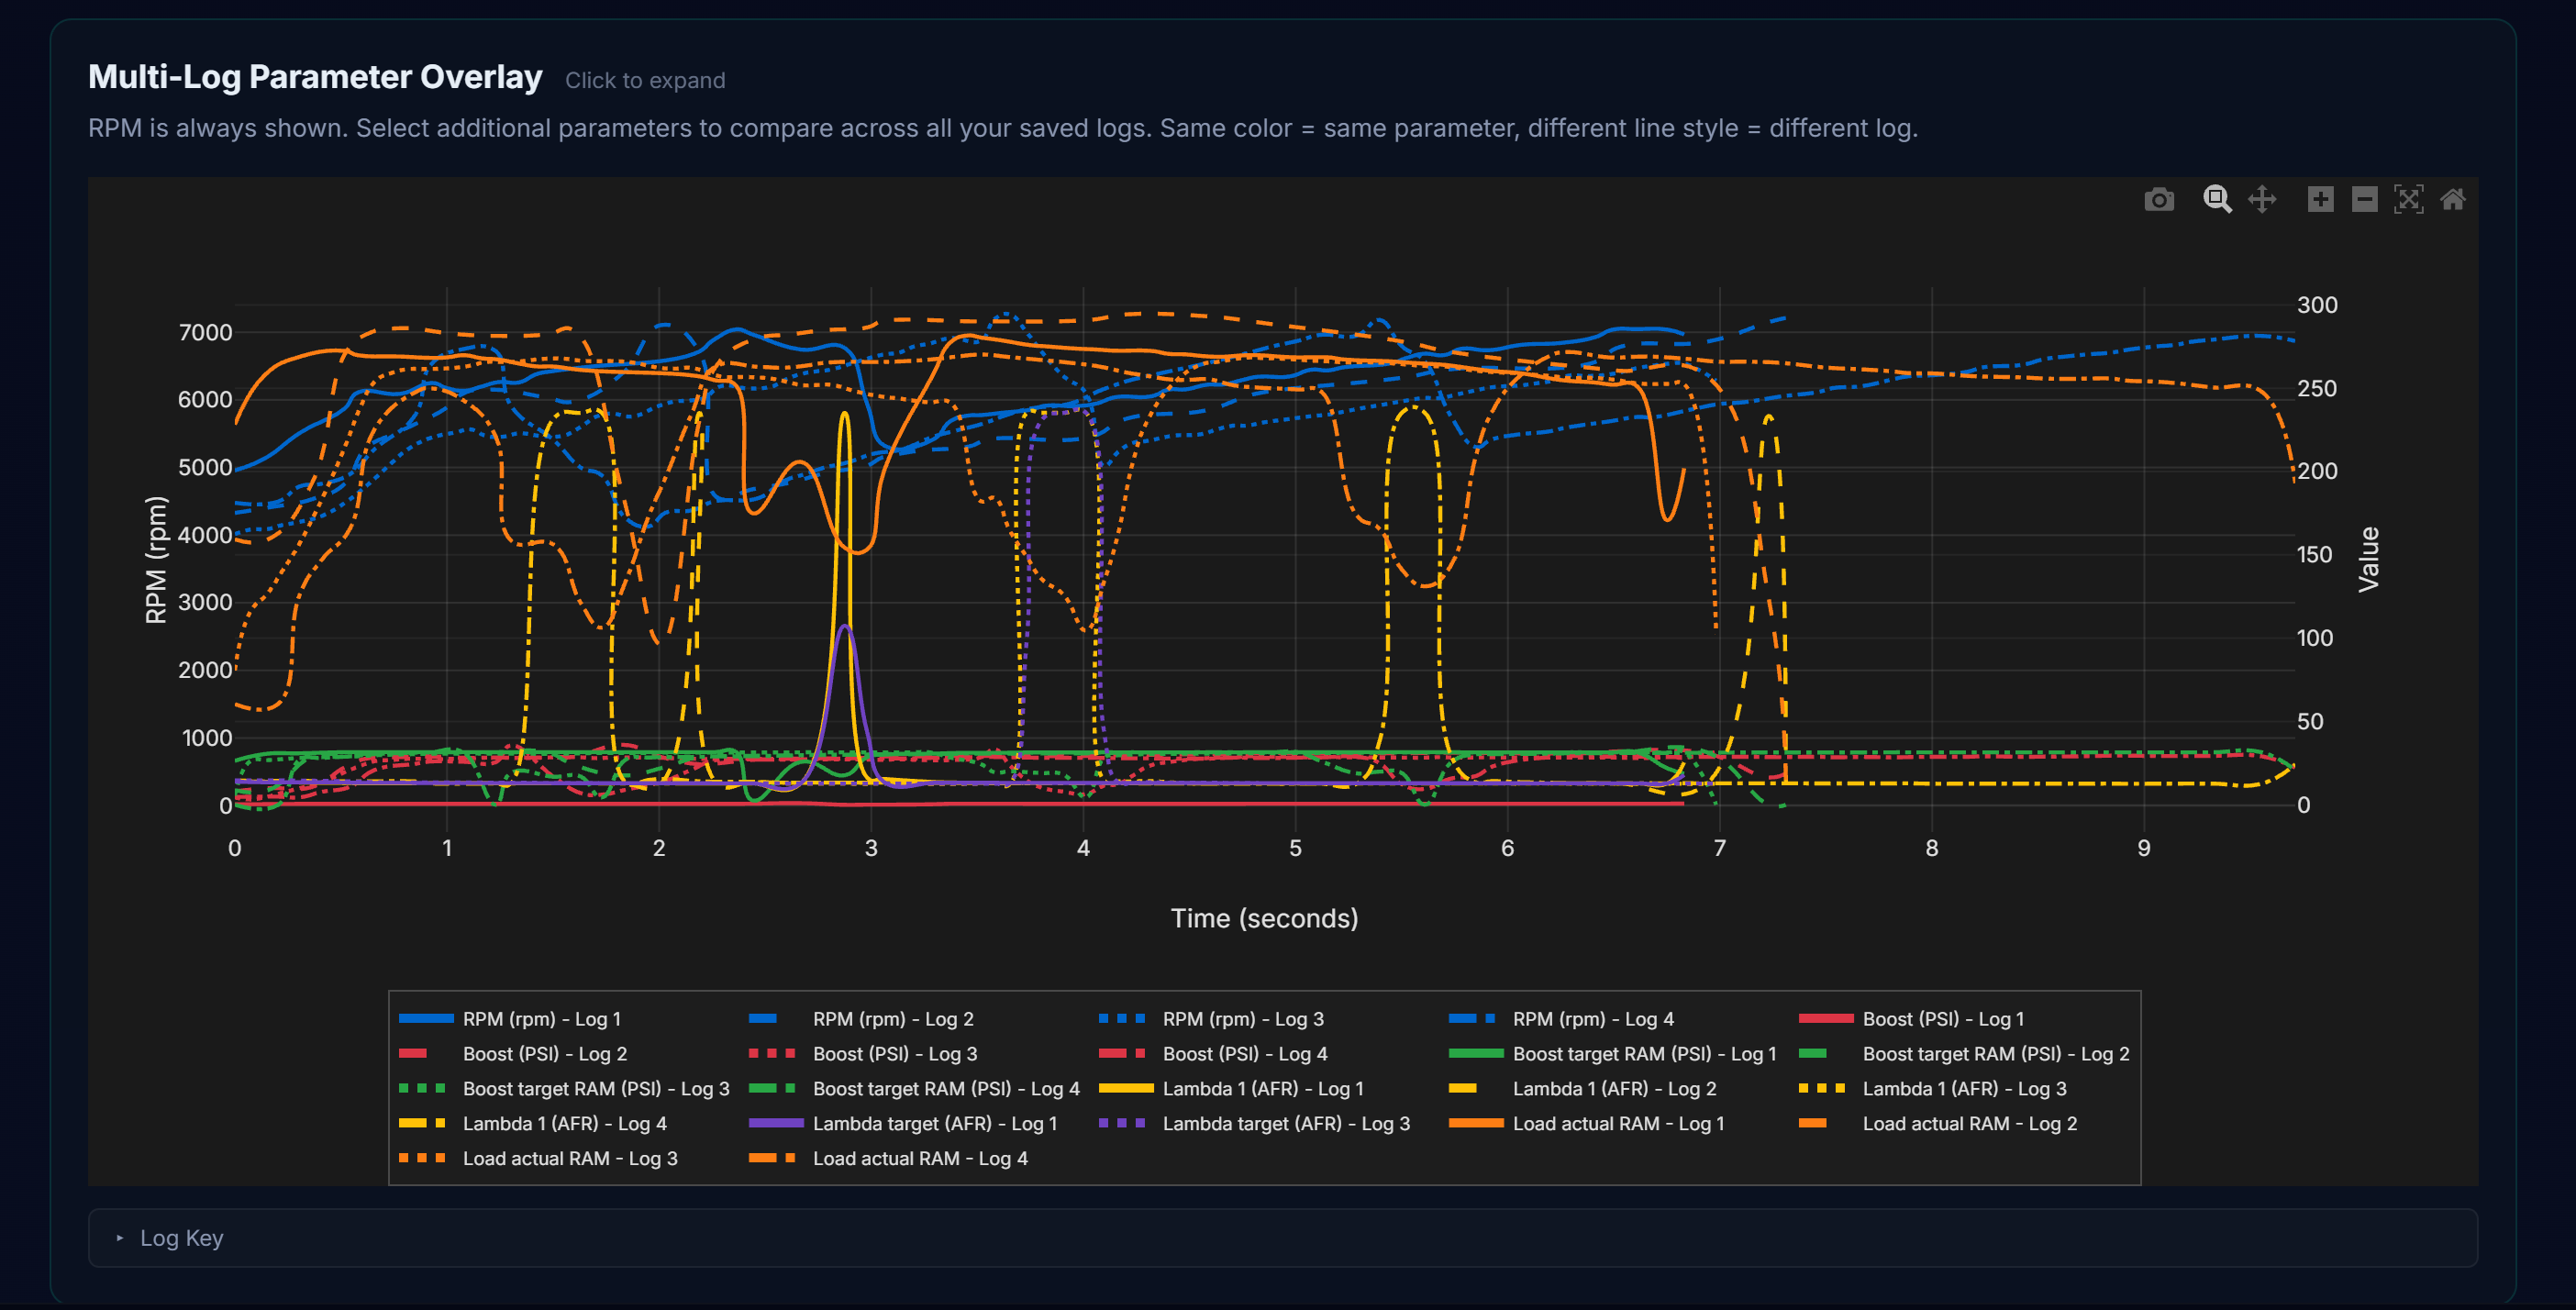
Multi-Log Visualization configuration interface showing log selection, parameters selection, and gear filter controls Multi-Log Parameter Overlay graph showing RPM and multiple parameters across different logs with color-coded line styles
Overlay multiple datalogs on a single graph and compare any combination of parameters to spot trends and see how your logs have changed over time.
spoolinops.com/analytics
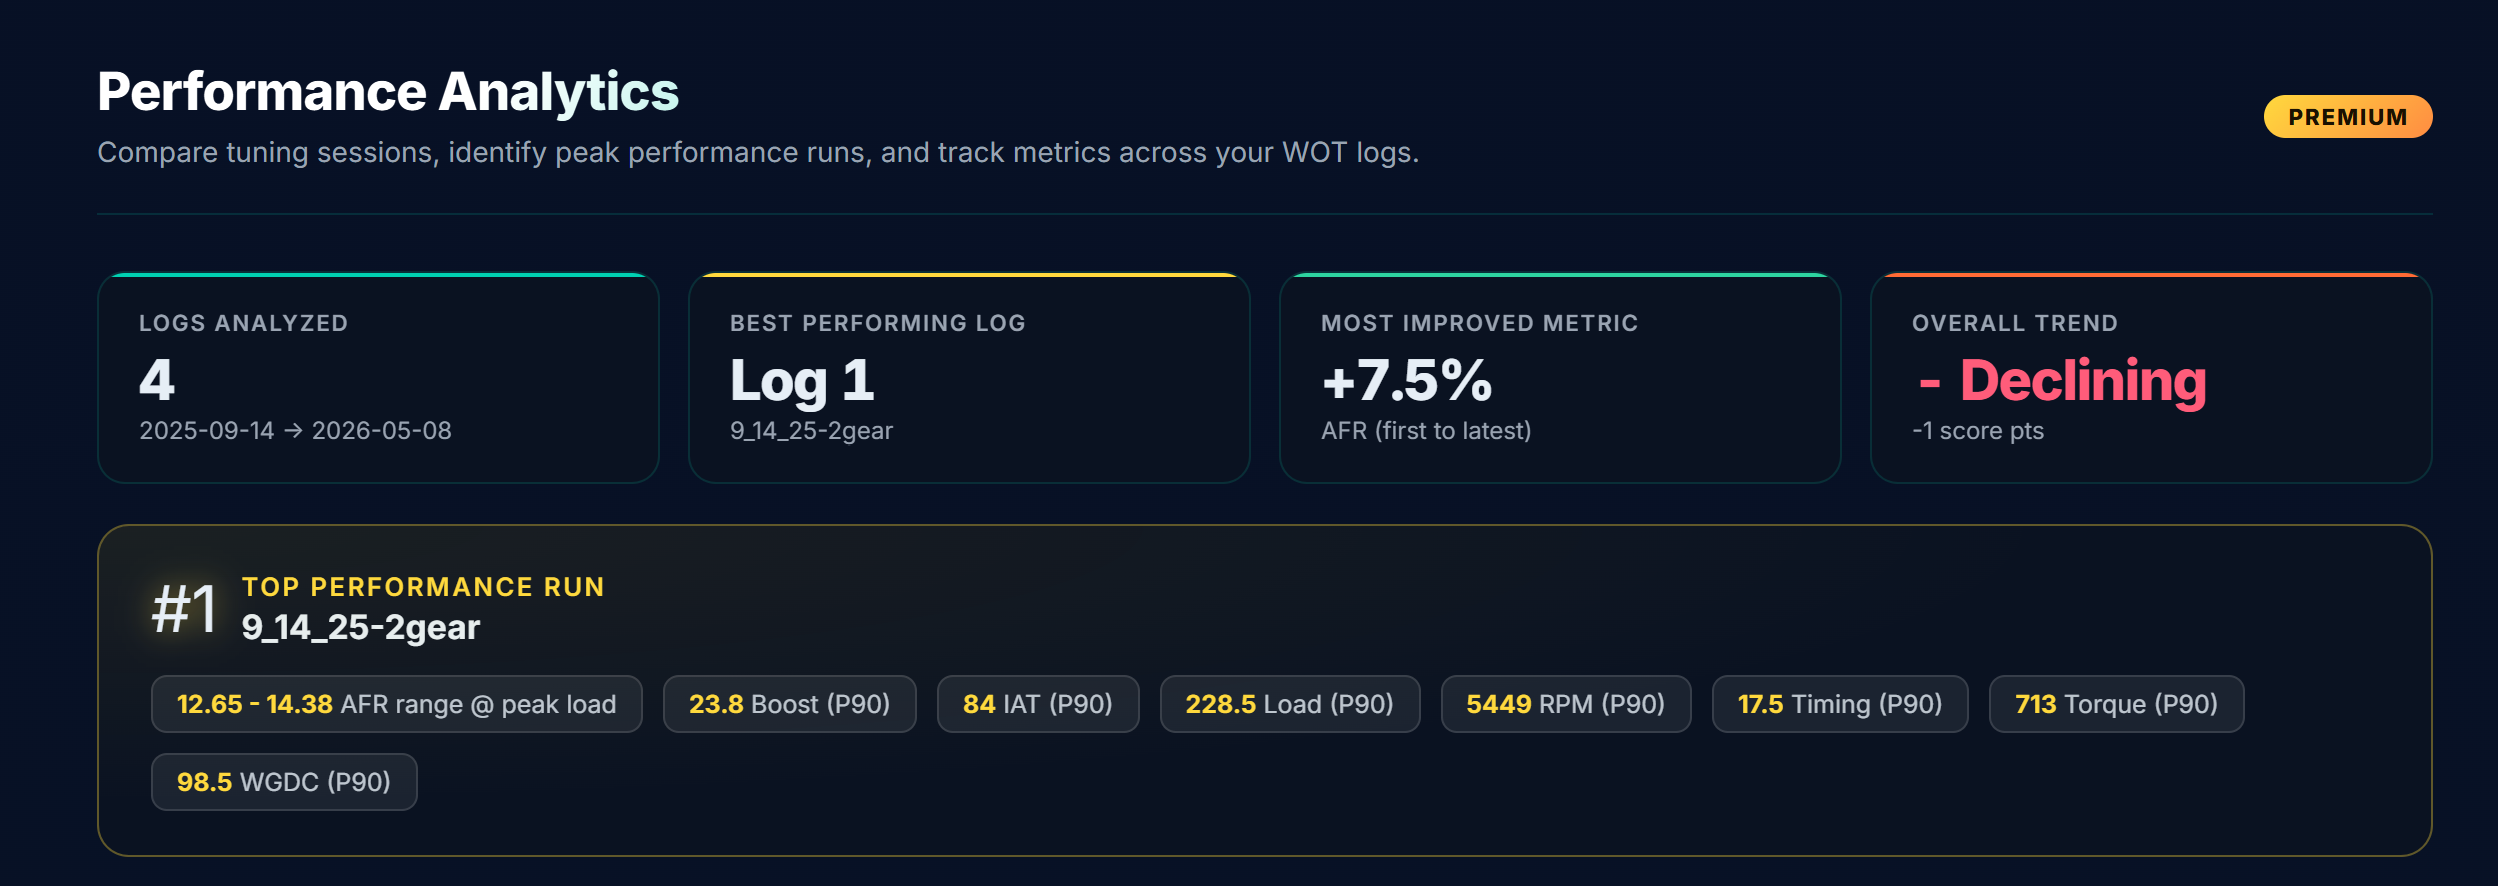
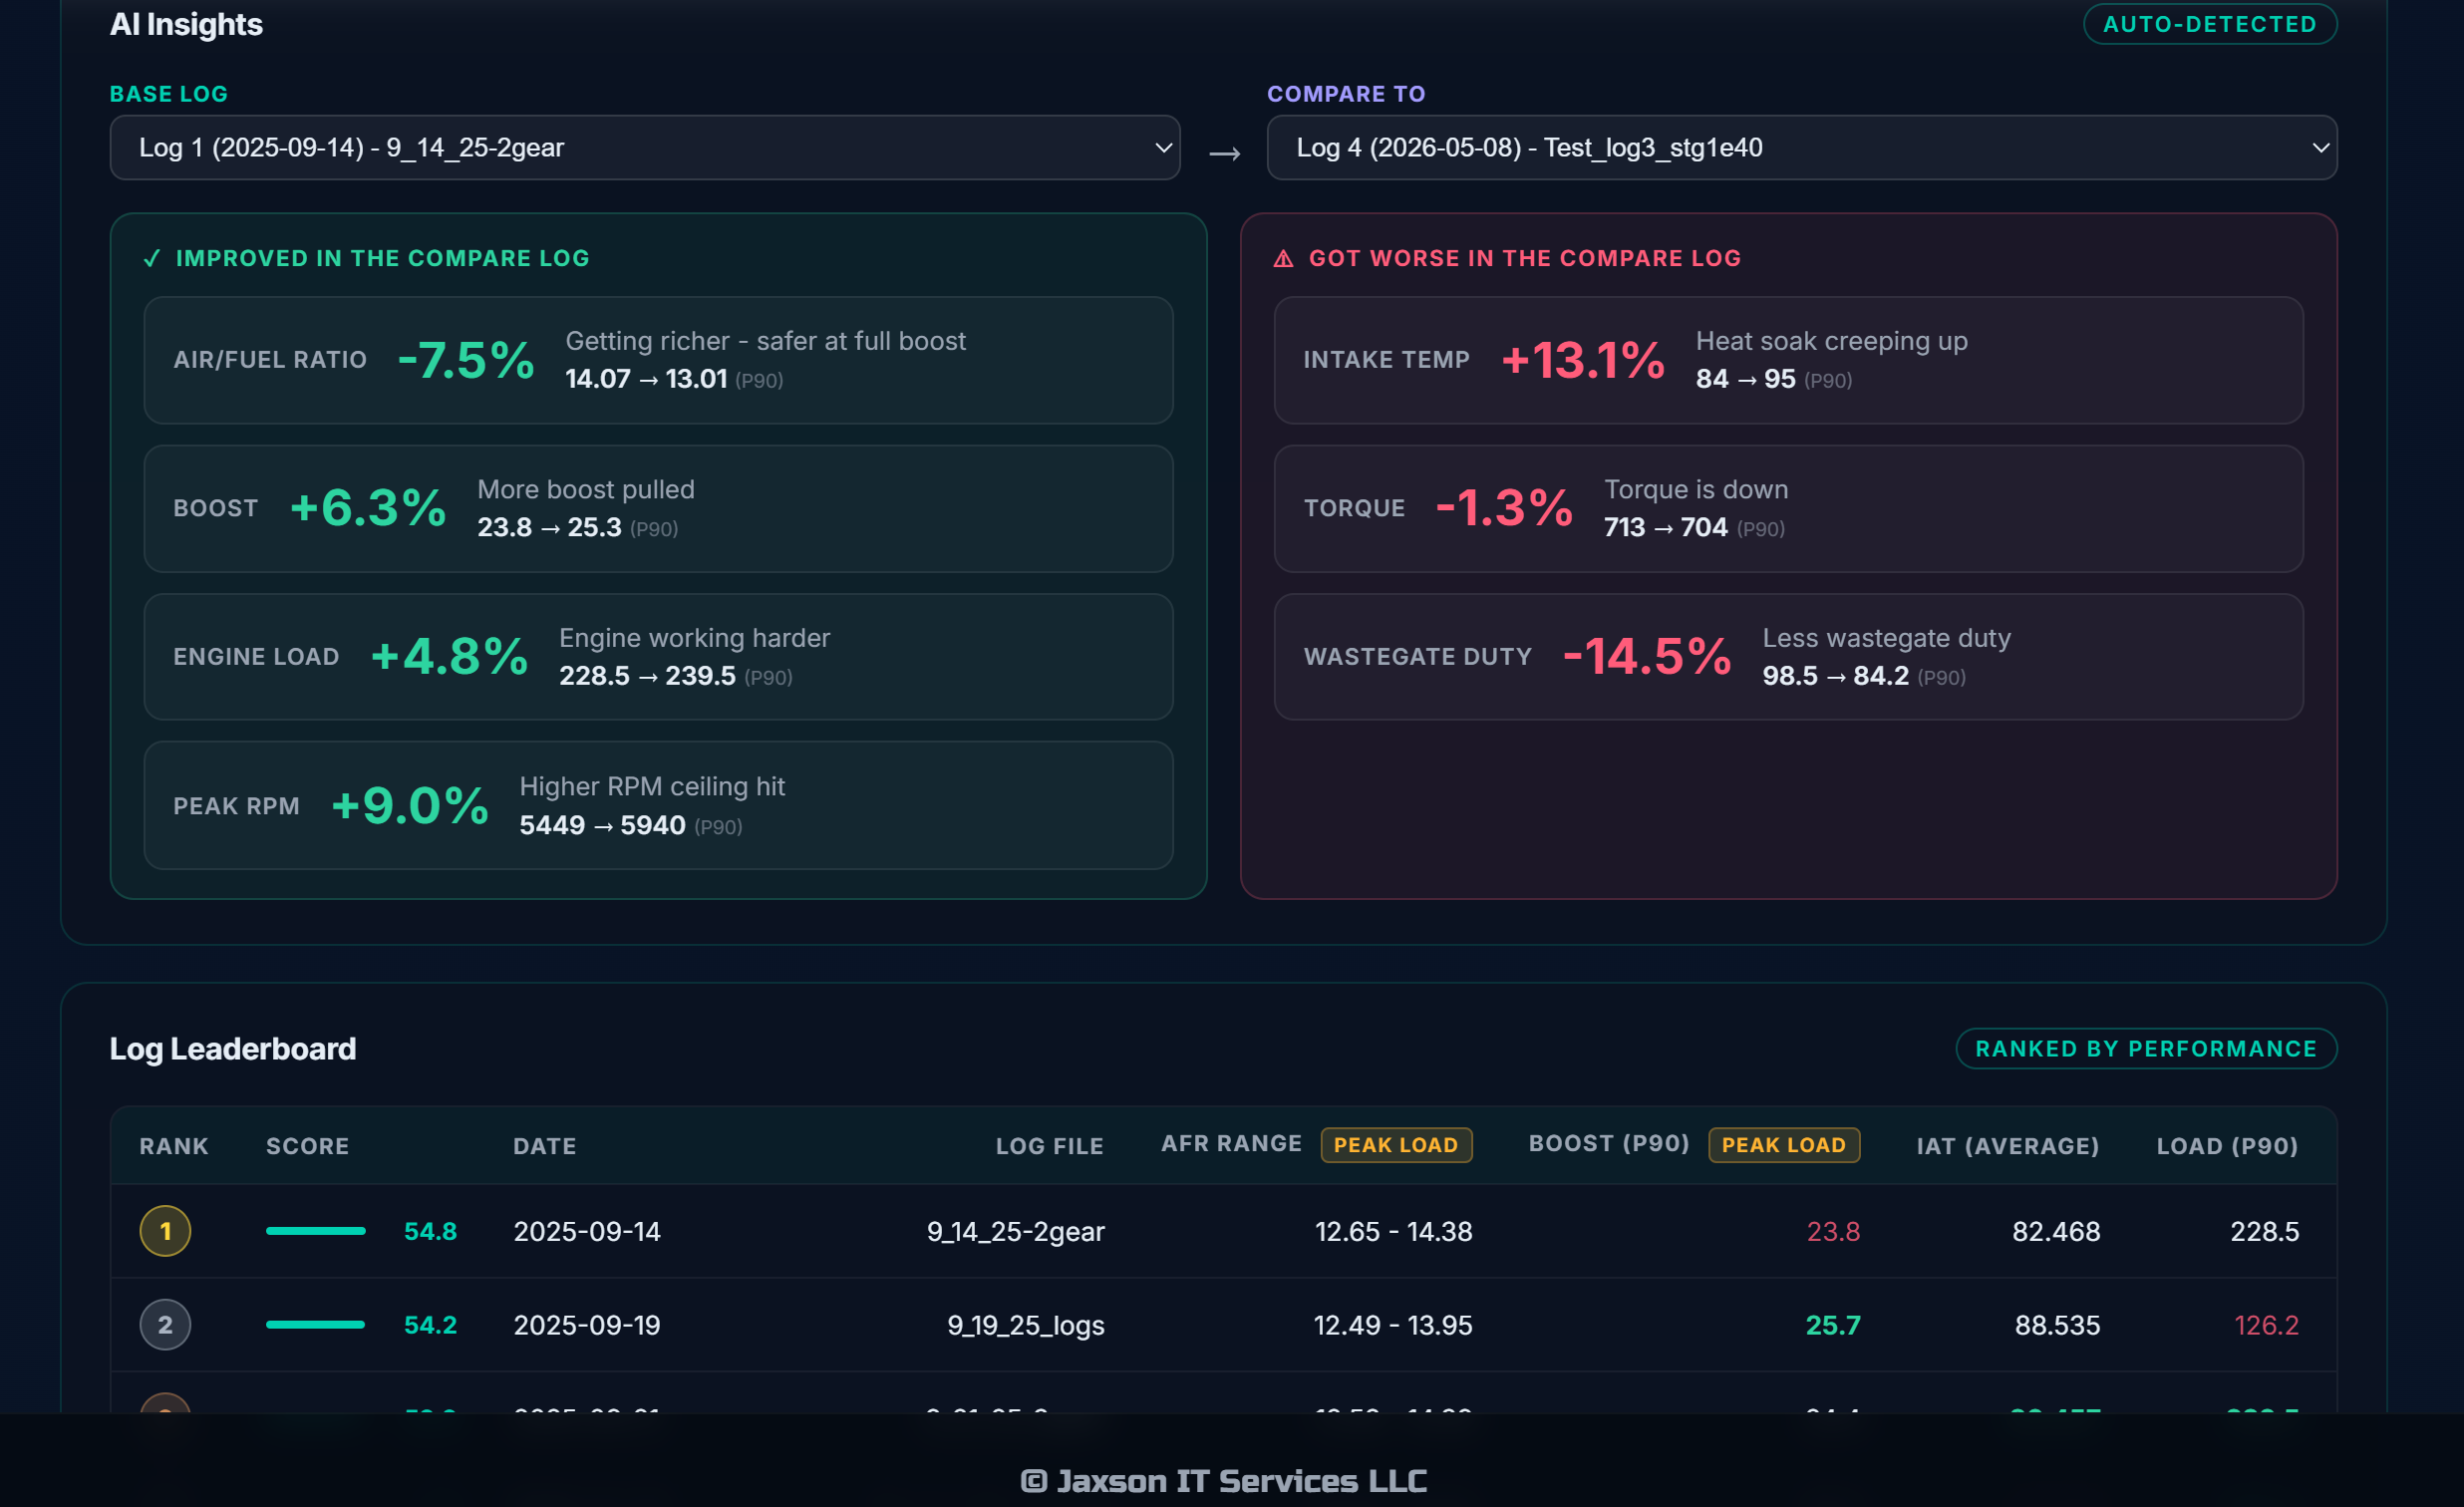
Performance Analytics dashboard header showing 4 logs analyzed, best performing log, most improved metric and overall trend Performance Analytics dashboard showing AI Insights comparison between two logs and a Log Leaderboard ranked by performance score
Track progress across tune revisions with summary stats, AI Insights highlighting what improved or regressed, and a leaderboard ranking your best pulls.
spoolinops.com/chat
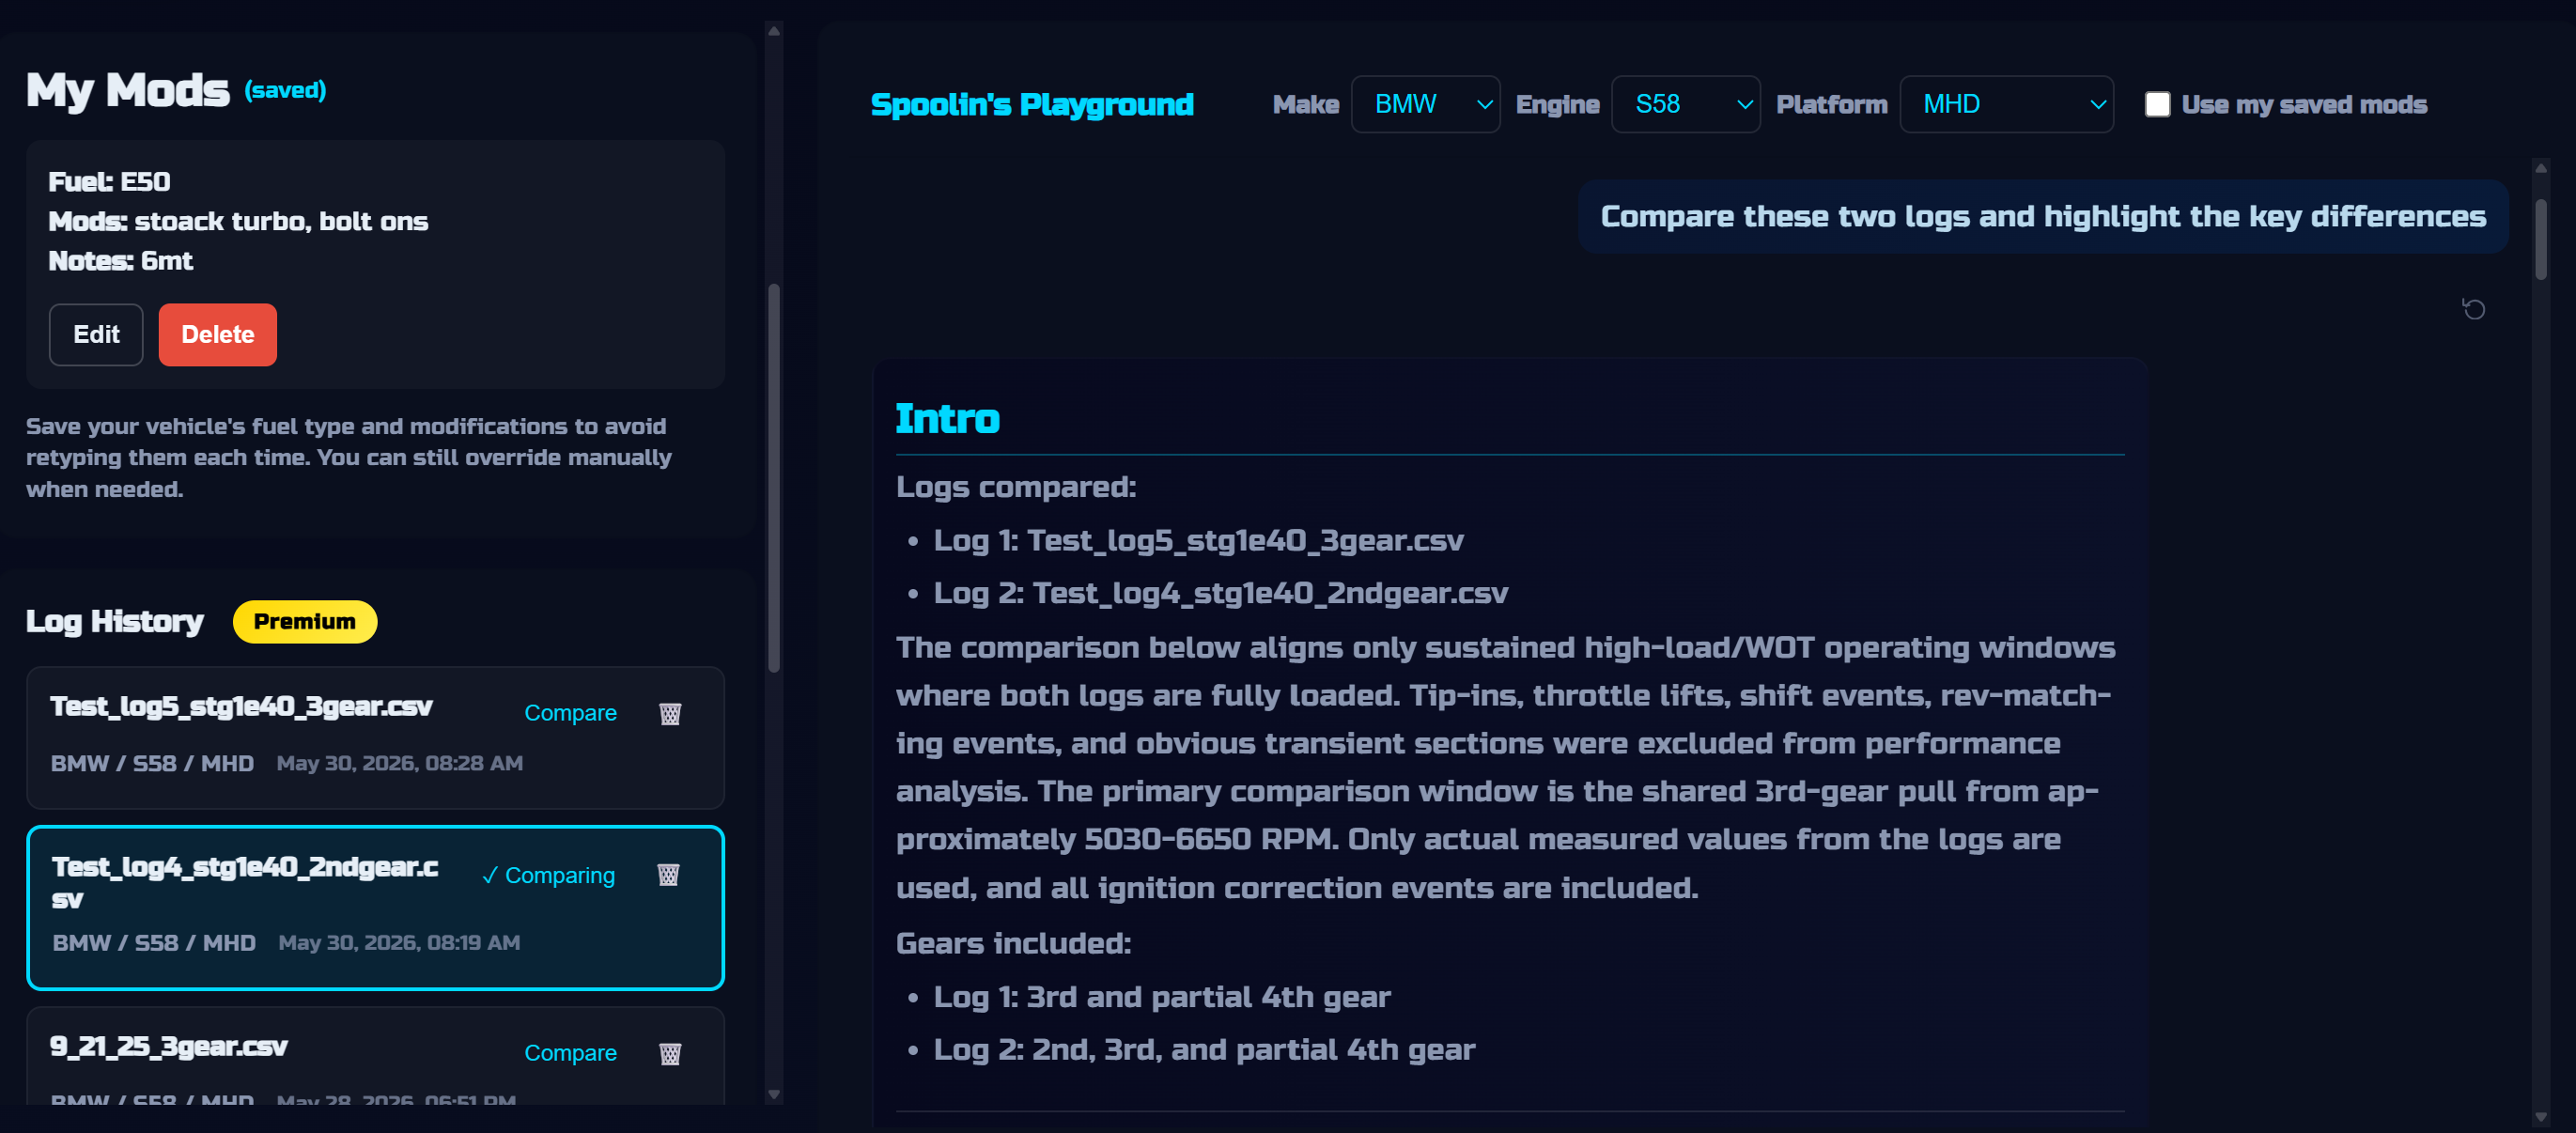
Side-by-side log comparison showing differences between two datalog sessions
Compare logs side by side and see exactly what changed between them, making it easy to evaluate tune revisions, hardware upgrades, or routine pulls.
Simple Process

Analysis in Four Steps

No additional software. Just upload your datalog and let Spoolin do the rest.

Select Your Vehicle

Choose your make, engine, and tuning platform from the dropdown. Spoolin tailors every analysis to your specific vehicle.

Upload Your Log

Export a CSV from one of the supported tuning platforms and upload it via the sidebar. Both single gear and multi-gear logs are supported.

Describe Your Mods

Tell Spoolin about your modifications directly in the chat, or create a saved My Mods profile and check Use My Saved Mods before starting your analysis (recommended).

Get Your Analysis

Start your log analysis via a prompt, and Spoolin returns a detailed, actionable report. Premium users can continue the conversation with follow-up questions.

What You Get

Everything You Need to Read a Log

SpoolinOps combines AI-assisted analysis with powerful tools for understanding, comparing, and tracking your vehicle's performance over time. Every analysis is tailored to your vehicle, engine, tuning platform, and modifications.

Full Log Analysis

Structured reports covering boost, timing, AFR, IAT, load, and fueling, with flags for anything outside the expected range. Choose Quick Mode for routine checks or Deep Mode for more thorough reasoning that uncovers subtle trends a quick pass might miss.

Safety Flags

Detects timing retard events, knock counts, wastegate duty cycle concerns, and any parameter trends that warrant attention before your next pull.

Follow-Up Conversations

Keep the conversation going. Ask Spoolin to explain specific RPM ranges, dive deeper into specific data points, or help you prepare questions for your tuner. Context from your log stays available throughout the session.

Interactive Graphs

Visualize any parameter in your datalog with custom graphs generated on demand. No exports, external tools, or copy-pasting required.

Visualize

View multiple datalogs on a single interactive graph. Overlay any combination of parameters to track changes and measure performance across WOT pulls.

Log Comparison

Compare two datalogs side by side to see exactly what changed between tune revisions, hardware upgrades, or routine pulls.

Performance Analytics

Track your vehicle's progression over time. AI Insights summarizes what improved or regressed between logs, and a ranked leaderboard shows your best pulls across all previously uploaded logs.